Pathway Analysis and Multi-Omics Data Visualization through AgileBioCyc
Interpret multi-omics measurements
AgileBioCyc is a collection of Agile BioFoundry organism-specific Pathway/Genome Databases that have been curated with engineered pathways and multi-omics measurements to enable scientists to visualize and analyze metabolic, regulatory, and genomic context in which these measurements were made. AgileBioCyc can interpret multi-omics measurements in the context of the metabolic and regulatory pathways of the host organism. AgileBioCyc provides a number of tools to aid in the analysis and visualization of mechanisms of action.
AgileBioCyc MultiOmics Analysis and Visualization tools
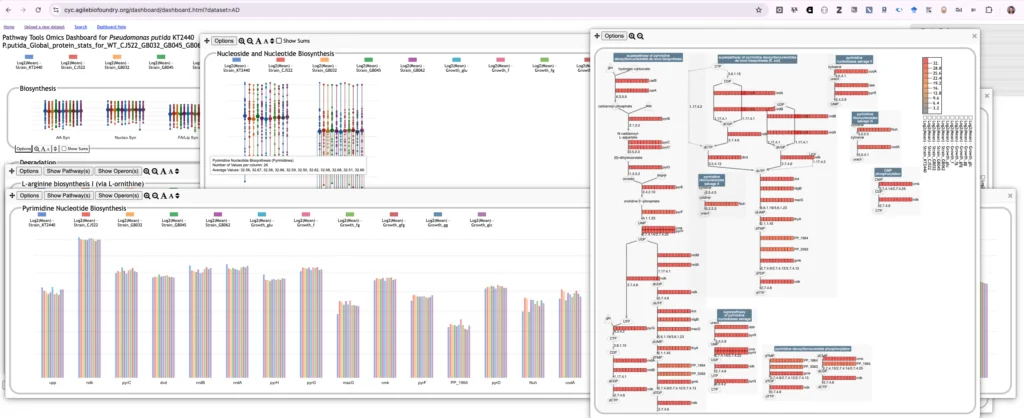
Used to link proteomics, metabolomics, and flux statistical analyses to knowledge about proteins, metabolites, and reactions that have been captured in the PGDB.
A tool for visualizing multiomics data. It facilitates a rapid user survey of how all cellular systems are responding to a given stimulus. It enables the user to quickly find and understand the response of genes within one or more specific systems of interest, and to gauge the relative activity levels of different cellular systems. The dashboard also enables a user to compare the expression levels of a cellular system with those of its known regulators.
AgileBioCyc Metabolic, Regulatory and Genome Browsers
Flux Balance Analysis (FBA) is a computational method for simulating an organism’s metabolic network. Metabolic models based on FBA depict a steady-state condition of a cell. Among the components of the simulation are the biochemical reactions in the organism’s metabolic network, the metabolites utilized by the organism as nutrients, the compounds secreted by the organism, and the biomass metabolites synthesized by the metabolic network. The nutrients are the inputs to the metabolic machinery, and the secretions and biomass metabolites are the outputs of that machinery.
The Regulatory Overview allows you to visually analyze the regulatory relationships between genes for a specific organism.
The genome browser can be used to examine one replicon (chromosome or plasmid) at a time. Its tracks capability can be used to visualize high-throughput datasets in a genome context.